


Electrostatic force microscopy (EFM) maps electrical properties of a sample surface by detecting the electrostatic force between the surface and a biased AFM tip. EFM applies a voltage between the tip and the sample while the cantilever oscillates above the surface, without contact. During the scan of the sample surface, the presence of electrostatic forces leads to a change in the oscillation amplitude and phase in the vertical deflection signal (figure 1). Therefore, the resulting EFM amplitude and phase images contain information about electrical properties including the surface potential and/or the charge distribution on the sample surface. For EFM, the relevant interaction force to image the electrical properties of the sample surface is the electrostatic force between the biased tip and the sample. However, in addition to the electrostatic force, shortranged van der Waals forces act between the tip and the sample surface. These van der Waals forces are used to measure the surface topography. There are two main approaches to decouple the electrostatic and van der Waals forces. The first approach exploits the different distance-dependence of the electrostatic and van der Waals forces by employing a dual pass lift-mode technique.
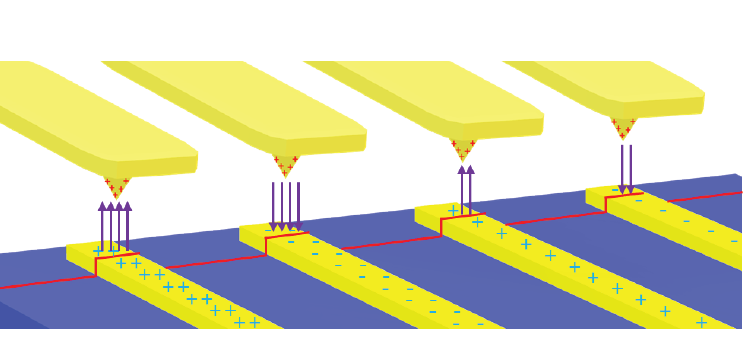
Figure 1. Electrostatic force acting between a metal-coated tip and locally charged domains on the sample surface. The EFM amplitude and phase image the magnitude and sign of the charging, respectively.
The second single pass approach uses a different frequency for the detection of the electrostatic force than for topography imaging. Here, the van der Waals force and electrostatic force are decoupled by using an additional lock-in amplifier for the EFM signal. Figure 2 shows the two approaches for the force decoupling.
The obtained signals of both techniques contain information on the surface topography (called ‘Height’) and the electrical properties of the surface (called ‘EFM amplitude’ and ‘EFM phase’) generated by the van der Waals and electrostatic forces, respectively. The two different measurement approaches are introduced separately in the following.
Lift-mode EFM
The working principle of lift-mode EFM is based on the fact that van der Waals and electrostatic forces have a different dependence on the tip-sample distance. While van der Waals forces act in tip-samples distance between 1 nm and 10 nm, electrostatic forces have a range of more than 1 μm. Thus, when the tip is close to the sample, van der Waals forces govern the tip-sample interaction. As the tip moves away from the sample, van der Waals forces rapidly decrease, and electrostatic forces become dominant.
Therefore, lift-mode EFM uses a dual pass approach: in the first pass scan, the tip maps the sample topography in a tip-sample distance, where van der Waals forces dominate. Then, the tip is lifted to a distance with negligible van der Waals forces, where electrostatic forces govern the tip-sample interaction. This distance is typically between 50-100 nm. In the second pass scan, the tip follows the topography scan of the first pass to achieve a constant tip-sample distance and thereby detects only the electrostatic force for EFM imaging, without topography crosstalk (figure 2a). Here, an additional tip bias increases the electrostatic interaction between tip and sample. To avoid drift effects between the topography and EFM scan, both passes are performed subsequently at each scan line.
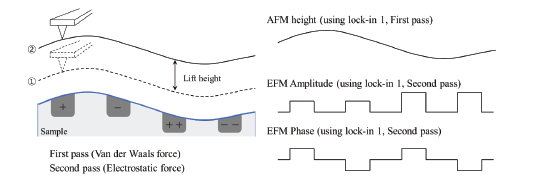

Figure 2. The schematic of (a) lift-mode EFM with single lock-in amplifier on a sample with differently charged areas. Each line is scanned twice: once close and one further away from the sample to decouple topography and electrostatics. Dual frequency EFM (b) is a single pass technique, which measures topography and electrostatic interactions simultaneously by using two different frequencies for detection. The resulting signals are EFM amplitude and EFM phase, which show the magnitude and the sign of the surface charges, respectively, as well as sample height.
For improved sensitivity and signal-to-noise ratio, both scans are performed in dynamic mode using lock-in detection. During the first pass, the tip oscillates at the cantilever’s resonance frequency in the attractive van der Waals force regime in Park’s true Non-contact mode, ensuring tip and sample preservation. In the second pass scan at constant tip-sample distance, the tip oscillation at resonance is now only sensitive to the electrostatic forces. The oscillation amplitude and phase on the second pass scan give the magnitude and sign of the sample surface potential. This single frequency EFM is easy to operate even with single lock-in amplifier. However, because of the property of the lift mode, it measures the EFM in far distance from surface and scan twice. This method is more time consuming and loses spatial resolution in the EFM amplitude and phase, compared to dual frequency EFM (see below).
Dual frequency EFM
Dual frequency EFM in current Park AFMs is designed to provide an efficient single pass method to acquire both topography and the EFM signals simultaneously, without loss of sensitivity. Dual frequency EFM allows complete separation of topography and EFM signals, as each of the signals is obtained at vastly different frequencies detected with two different lock-in amplifiers (figure 2b). The tip scans the surface topography by oscillating at the cantilever resonance ω0 to obtain a Non-contact mode topography image. At the same time, an AC bias with a frequency of ωtip is applied to the tip via the second lock-in amplifier as well as a DC bias. The electrical excitation of the tip leads to an oscillating electrostatic force between the biased tip and the charged surface. The second lock-in amplifier decouples the motion of the tip introduced by the electrostatic force at the AC frequency ωtip from the topography signal detected at resonance ω0. The amplitude and phase at ωtip contain information on the magnitude and sign of the surface charge. The frequency ωtip should be small compared to cantilever’s mechanical oscillation frequency ω0 to avoid interference between the two signals. Typically, Park AFMs use frequencies of ωtip~10 to 20 kHz for the AC excitation.
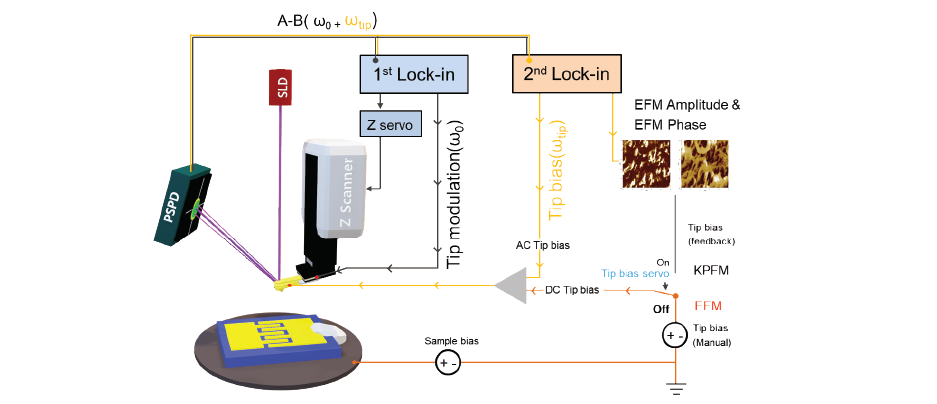
Figure 3. The schematic diagram of the experimental setup for dual frequency EFM, which uses an additional second lock-in amplifier to excite and detect the oscillating electrostatic force at low frequencies.
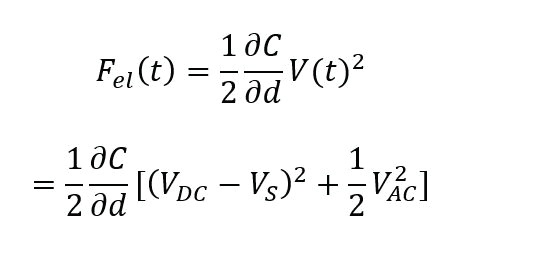
A schematic diagram of the experimental setup of dual frequency EFM is shown in figure 3. The additional lock-in amplifier for the EFM signal is embedded in the AFM controller and serves two purposes: the first the application of the AC voltage with the frequency ωtip, in addition to the DC bias. The second is the separation of the signal component at ωtip, which carries the EFM data, from the topography signal detected at the cantilever resonance ω0. In the dual frequency EFM, the tip and the sample can be viewed as a capacitor, with an oscillating electrostatic interaction force Fel given as:
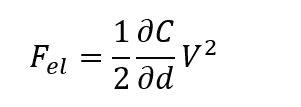
With tip-sample capacitance C in a distance d and the total voltage V. Since both AC and DC voltages are applied simultaneously between the tip and the sample, the total voltage V between the tip and the sample is expressed by the following equation:
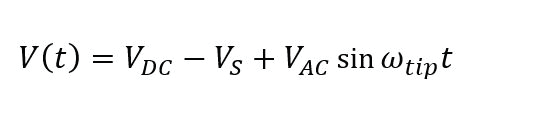
Where VDC is the DC tip bias, VS is the surface potential on the sample and VAC and ωtip are the amplitude and frequency of the applied AC voltage, respectively. The combination of equation 1 and 2 results in three terms that describe the electrostatic force:
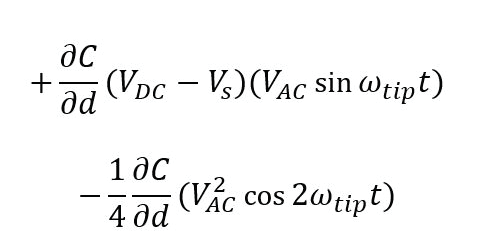
These terms can be referred to as static DC term (a), and two AC terms at ωtip (b) and 2ωtip (c). Whereas the static DC term is difficult to detect, the second lock-in amplifier used for EFM can accurately decouple the AC term at ωtip to image the electrostatic properties of the sample. The amplitude at ωtip contains information on the magnitude of the electrostatic charging of the sample, while the phase contains information on the sign of the surface charge.
The key advantages of dual frequency EFM compared to lift mode EFM are as follows:
- • Small electrical load due to a smaller tipsample distance
- • High spatial resolution as non-local crosstalk is avoided by small tip-sample distance
- • Significant time savings due to single pass technique
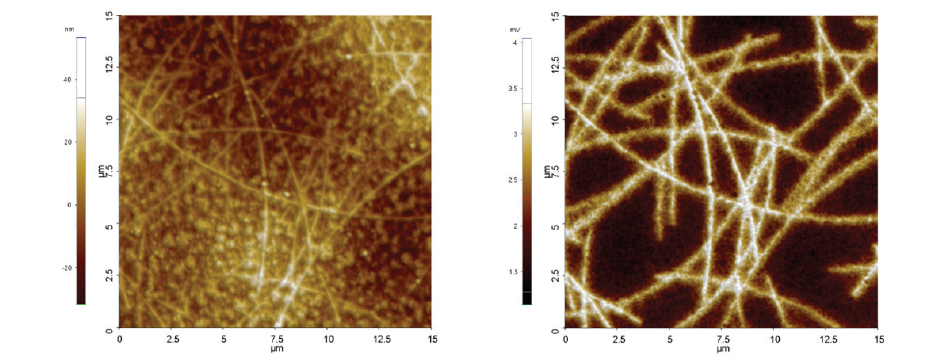
Figure 4. (a) AFM height and (b) EFM amplitude of PET coated nanowires. In the EFM amplitude the nanowires are clearly distinguishable from the PET coating.
Figure 4 shows the AFM height image (a) and EFM amplitude (b) when a 15 μm by 15 μm scan on PET coated nanowires. While some nanowires are visible on the height images even after PET coating, most nanowires are not distinguishable from the surface height images by thick PET coating. However, after applying sample bias to the bottom electrode, the tangled nanowires have a higher surface charging than the coating and are clearly visible in the EFM amplitude.
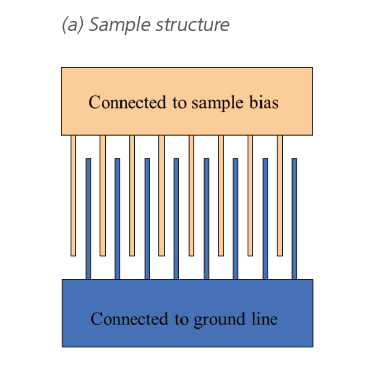
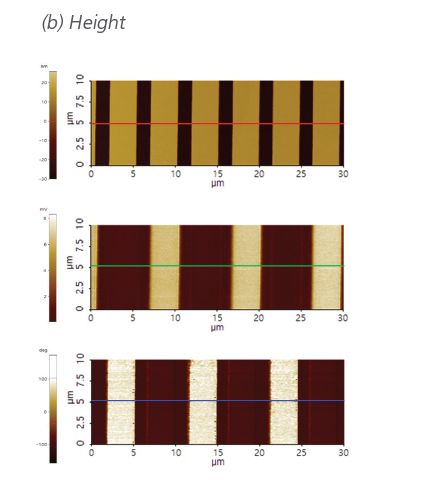
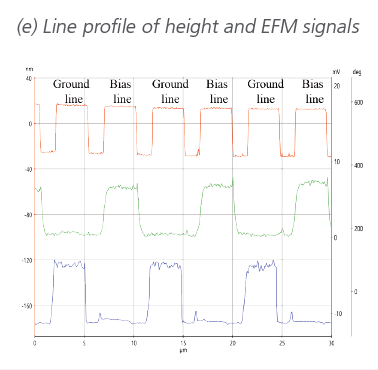
Figure 5. EFM measurement on a gold electrode structure on SiO2. (a) Schematic of the interdigitated electrode structure, where alternating electrodes are grounded and biased. (b) AFM height image, (c) EFM amplitude and (d) EFM phase showing contrast on the charged electrodes and no contrast on the grounded electrodes (e) line profile of height and EFM signal.
An EFM measurement of Au patterns on a SiO2 substrate is shown in figure 5. The sample consists of two microcomb-shaped electrodes. One of the Au electrodes is connected to the ground while the other is connected to the sample bias. The electrodes are 30 nm high (25 nm Au and 5 nm Ti) on a 100 nm thick oxide layer on Si substrate for insulation between the interdigitated electrodes.
By applying a DC bias of +0.5 V to the sample, the EFM signals between grounded and biased electrodes are clearly distinguishable.