


Mina Hong, Gerald Pascual, Byong Kim and Keibock Lee
Technical Marketing, Park Systems, Inc., Santa Clara, USA
Abstract
Collagen is a protein that provides structure in various connective tissues in animals and can be found in ligaments, tendons, and skin. The characterization of collagen's mechanical properties at nanoscale can potentially reveal significant insights into the causes of macroscale phenomena such as the elasticity of skin and its degradation as we age. One tool that has been used to acquire nanoscale data of collagen is the atomic force microscope (AFM). Conventional AFM techniques based on force-volume spectroscopy have been used to analyze the topography and mechanical properties of collagen. However, these techniques are extremely time-consuming— acquisition of a quantifiable elasticity map can take hours to complete. A new AFM-based nanomechanical mode has been developed to address this drawback and can perform the same task significantly faster without sacrificing resolution. Our investigation revealed that our sample collagen bundles had diameters ranging from 60 to 600 nm and an average elastic modulus of about 1.9 GPa, a value in agreement with other reported research. The total time taken to acquire this data was measured in minutes as opposed to hours.
Introduction
The research on the molecular structure, functions, and mechanisms of collagen has triggered much attention since the middle of twentieth century due to the fact that collagen is the most abundant (25-35%) protein in mammals [1]. It is crucial to characterize the structure, functions and mechanical properties of collagen since it extensively contributes to the function of connective tissues such as bones, skins, muscles and tendons. For instance, skin is largely made of collagen which in turn is composed of smaller nanofibers or segments. As the body ages, collagen begins to breakdown which results in the decrease of skin elasticity and tensile strength. Therefore, understanding the properties of collagen is significantly important in understanding how our bodies change over time.
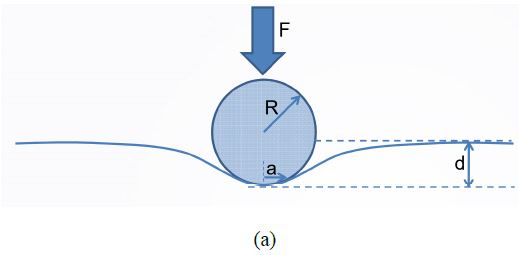
The atomic force microscope (AFM), a powerful nanotechnology tool, has been widely used to determine the morphology, mechanical properties and in-situ self-assembly processes of collagen [2-5]. Conventional techniques to characterize these fibers are mainly based on force volume spectroscopy. However, these techniques have been recognized as being exceedingly slow–it takes hours to acquire a quantifiable elasticity map. The demand for a much faster technique has been driving R&D scientists and engineers for years. Finally, a new AFM-based fast nanomechanical mode, called PinPoint nanomechanical mode, has been developed which is at least two orders of magnitude faster than the traditional force-volume techniques [6]. With this new mode, the same quantifiable elasticity map can be acquired within the space of minutes and with a correlated topography image that reveals the position and orientation of sample. This mode is a new application tool for acquiring real-time topography and quantitative mechanical properties maps of various materials from hard disks to soft tissues. The force curve taken at each pixel is used to calculate the mechanical characteristics of the material. To obtain the elastic modulus, the curves are fitted with the Hertz model. Even though this model assumes zero friction between the indenter and the sample and the materials to be isotropic and elastic, it has been extensively applied by the AFM community to quantify the mechanical properties of biological samples [7-9]. Assuming an elastic sphere tip with radius R indents in an elastic halfspace to a displacement of d, the applied force can be derived as (Figure 1a):
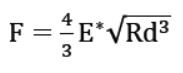
where E∗ is the effective elastic modulus and can be calculated from measured F, R and d. In addition, E∗ is a function of two materials:
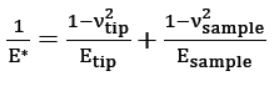
where Etip and Esample are the elastic modulus of the two materials and νtip and νsample are their corresponding Poisson's ratio. The Poisson's ratio is set to 0.5 for incompressible rubbers and biological soft samples so for soft materials we make νsample to be 0.5. Knowing E∗, Etip, νtip and νsample, Esample can be back-calculated.
 (b)
(b)
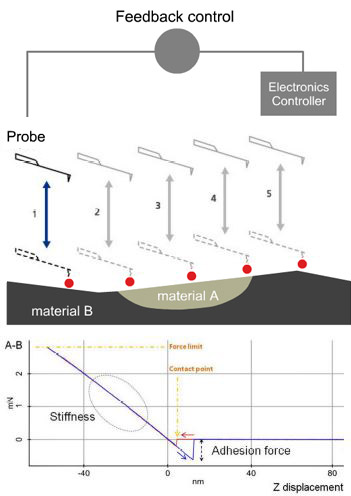
Figure 1. (a) Sketch of the indentation experiment showing the interaction between a sphere indenter and a deformed surface. (b) Working mechanism of PinPoint™ nanomechanical mode by Park Systems. The probe is moved from position 1 to 5 and at each point, force-distance curves are taken to calculate the nanomechanics of each point.
Thanks to the well-defined control of the XY scanner of modern AFM systems and operation software, PinPoint is able to provide high-speed force-distance (F-d) curves with accurate control of both contact force and time (see the working mechanism in Figure 1b [6]). The tip is lifted up before moving to the next pixel to effectively prevent sample damage or tip wear due to the lateral force. Additionally, compared to the traditional AFM force-volume mode which, for example, takes several hours to finish a 128 × 128 pixel image, this new faster technique only takes the user several minutes to provide high-resolution topography images as well as maps of various mechanical properties such as stiffness, adhesion force, modulus and deformation. In this manuscript, we report our imaging experience on collagen fibrils using this AFM-based fast nanomechanical mode.
Experiments
The dehydrated collagen fibril sample provided by our collaborators at Niigata University was cut and spin-cast on a petri dish and imaged with a commercial AFM system [10] in ambient conditions using a fast nanomechanical mode. In order to get the most accurate mechanical properties data, the spring constant of the cantilever needs to be chosen carefully. The medium stiffness FMR probes [11] were selected based on the relative stiffness of its cantilevers compared to that of the sample. This is important because this relationship determines the ease of acquiring a feedback signal and the degree at which to which the sample and probe geometry are preserved. The tests were repeated with three different FMR probes to prove the reproducibility and consistency of this mode. Beforehand, we also imaged a polystyrene low density polyolefin elastomer (PS-LDPE) standard calibration sample as a reference for accuracy verification of the mode. The PS-LDPE is a copolymer sample mounted on a 12mm steel sample puck. A blend of PS and PE were spin-cast onto a silicon substrate, creating a film with different material properties. PS with an elastic modulus of around 2 GPa serves as the matrix while PE is the low density doping component with an elastic modulus of around 0.1 GPa [12]. In addition, the collagen sample was also imaged in-situ in phosphate buffered saline (PBS) solution (pH=7.4) provided by Thermo Fisher Scientific to test the capability of this mode in liquid.
Results and Discussions
Operation of the fast nanomechanical mode was facilitated by the AFM system’s operational software [13]. This process is also nearly identical in both air and liquid conditions, with only a few parameters needing adjustment. First, we tested the PS-LDPE standard sample and Figure 2 exhibits high-resolution topography and mechanical data images (image size of 96×96 px and a scan size of 1.6μm×1.6μm) that were all collected within 3min. The unambiguous and high-contrast adhesion force (Figure 2b), modulus (Figure 2c) and stiffness (Figure 2d) images were captured in real time with the topography image (Figure 2a). All post-processing on images was handled with software provided with the AFM. The cross-section profile of interesting areas in an image can be shown to get information of the samples across that plane. Figure 3 exhibits the difference in modulus of the PS and PE samples (original image Figure 2c) and with readings of about 2.7GPa and 0.3GPa respectively. These values are comparable to the values of 2GPa and 0.1GPa as claimed by the calibration sample supplier considering reasonable errors, such as the cantilevers (differences in force constant, tip radius, tip’s Poisson’s ratio), the models applied to fit the force curves and the conditions the samples had been kept under, etc.
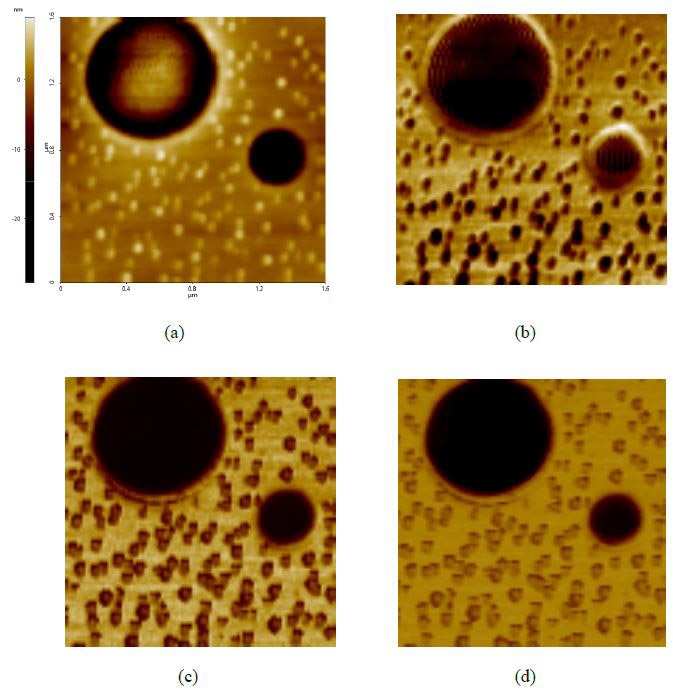
Figure 2. PinPoint™ nanomechanical images of PS-LDPE standard sample include (a) height, (b) adhesion force, (c) modulus and (d) stiffness. Images pixel 96 × 96 and scan size 1.6μm × 1.6μm.
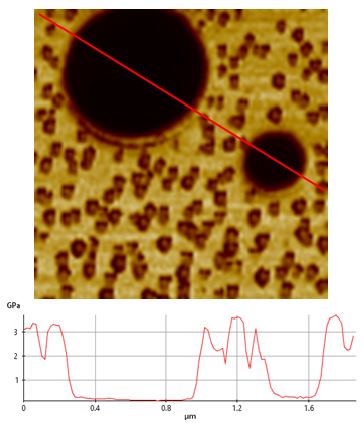
Figure 3. Cross section line profile of the PS-LDPE modulus data (Figure 2c) exhibiting that the modulus of PS and PE is around 2.7GPa and 0.3Gpa, comparable with the 2GPa and 0.1GPa claimed by the sample’s manufacture.
Further tests on collagen fibrils also provided us with high-quality topography and nanomechanical property mapping (Figure 4 and 5). The repeatability and consistency of the AFMbased fast nanomechanical mode are well kept among repeated experiments with different FMR cantilevers. All images clearly reveal distinct differences between the collagen fibrils and the substrate. The thinness of the fibrils, on the order of tens of nm, and the tiny segments that form them can be clearly identified in all images. The diameter of the collagen bundles we observed extends from ~60nm to ~600nm, depending on number of microfibrils the bundle is comprised of, which can vary from tens to thousands of microfibrils [14]. From Figure 4c, we measured the collagen’s elastic modulus and the average value turned out to be around 1.9GPa. This is in agreement with the work reported by Gautieri et al. that the difference in Young’s modulus from wet (~300MPa) to dry (~1.8-2.25GPa) collagen was significant [5]. In order to verify the function of PinPoint in liquid, we picked an area of interest and imaged in-situ in the PBS solution. All data is shown in Figure 5, before and after hydration of the sample. The diameter of the bundle increased from 1.31μm (in air) to 1.68μm (in liquid) due to the hydration of the protein, which can be clearly observed in Figure 5a and 5b. In addition, the modulus of the fully hydrated collagen in liquid significantly dropped to only 4-12MPa, reasonable numbers for liquid collagen samples reported by previous publications [6].The individual fibrils and small segments became very hard to see compared to those in air and one possible reason is that FMR cantilever is too stiff for measurement of soft collagen even though it works perfectly for collagen in air. During the drying process of the collagen, we also tested the sample’s modulus which turned out to be a few hundred MPa in magnitude. Increases in the modulus of the fibrils were observed as having a strong positive correlation to the extent at which the fibrils were dehydrated. The mechanisms of this phenomenon will not be discussed here.
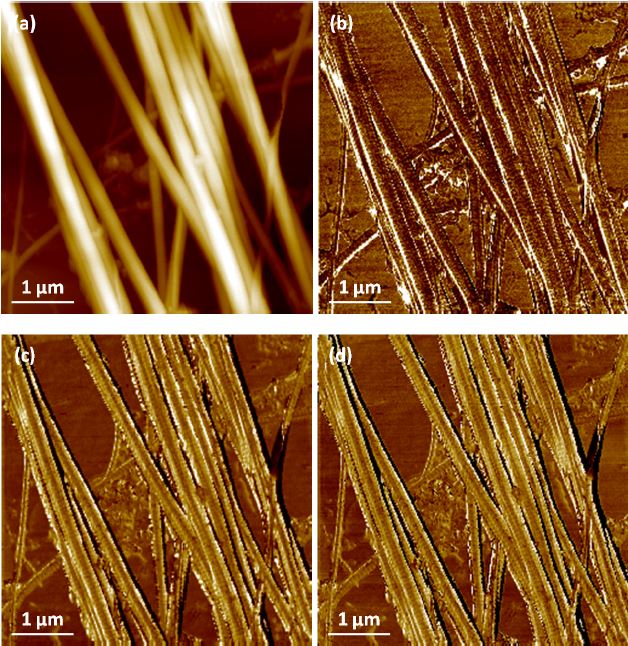
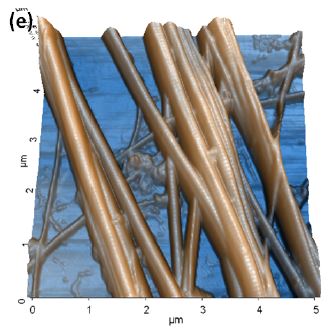
Figure 4. PinPoint™ nanomechanical images of collagen include (a) height, (b) adhesion force, (c) modulus, (d) stiffness and (e) contrast enhanced 3D structure. Image pixel 256×256 and scan size 5μm×5μm.
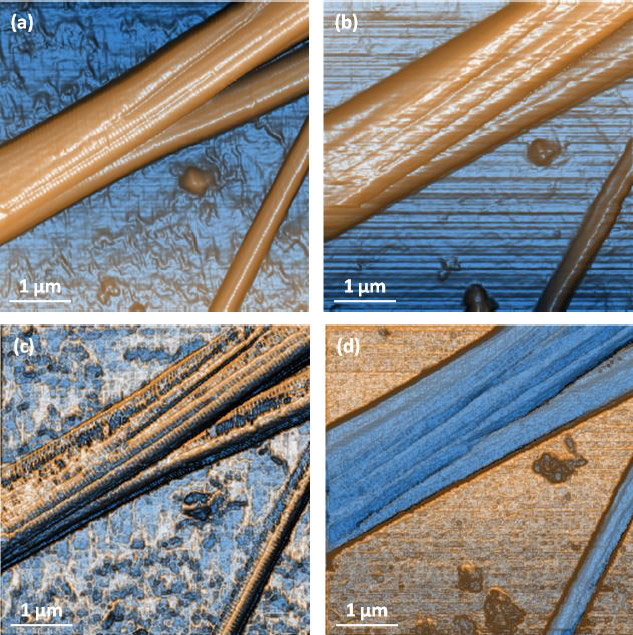 Figure 5. Contrast enhanced height images of collagen in (a) air and (b) liquidand modulus mapping in (c) and liquid (d) showing that collagen significantly softens when hydrated. Image pixel 256×256 and scan size 5μm×5μm.
In all, collagen fibrils are a widely accepted standard sample for measurements of biological and soft material properties. Given the strength of our findings with this mode, we are confident that PinPoint can be very useful in many similar applications that require the collection of quantitative, highquality topography and mechanical property mapping.
Summary
The topography and mechanical properties of PS-LDPE and collagen fibril samples have been efficiently and accurately imaged both in air and liquid using a commercially available AFM system in a fast nanomechanical mode called PinPoint. Since the cantilever is lifted and moved from pixel to pixel, PinPoint can minimize the lateral force on the probe and protect both it and the sample from damage. Force-distance curves are taken and analyzed at each pixel, which are further turned into quantitative and low-noise mechanical mapping over a wide range from MPa to GPa. Using this mode, one can characterize the mechanical properties on a surface and post-process the information from a cross section easily. High-contrast mapping of mechanical properties including adhesion force, modulus, stiffness and deformation are taken in real-time with high-resolution height imaging. We believe that this new mode will be able to successfully provide researchers with critical material surface morphology and nanomechanical property information to help them acquire a better understanding of their samples at the nanoscale.
REFERENCES
[1] Di Lullo, G.A., et al., J. Biol. Chem. 277 (2002) 4223-31.
[2] Narayanan, B., et al., Langmuir 30 (2014) 1343-50.
[3] Su, H., et al., Nanoscale 6 (2014) 8134-39.
[4] Berenguer de la Cuesta, F., et al., Proc. Natl. Acad. Sci. 106 (2009) 15297-301.
[5] Wenger, M.P.E., et al., Biophys. J. 93 (2007) 1255-63.
[6] PinPoint Nanomechanical Mode | http://www.parkafm.com/index.php/park-afmmodes/ nanomechanical-modes?i=0
[7] Ladjal, H., et al., 2009 Ieee-Rsj International Conference on Intelligent Robots and Systems. 2009, New York: Ieee. (2009) 1326-32.
[8] Soufivand, A.A., M. Navidbakhsh, and Ieee, 2012 19th Iranian Conference of Biomedical Engineering (Icbme) (2012) 141-4.
[9] Kuznetsova, T.G., et al., Micron 38 (2007) 824-33. [10] Park NX10 AFM | http://www.parkafm.com/index.php/products/research-afm/park-nx10/overview
[11] http://www.parkafm.com/index.php/service/probe-store/351-fmm
[12] http://www.brukerafmprobes.com/a-3724-ps-ldpe-12m.aspx
[13] Park SmartScan, Park AFM Operating Software | http://www.parkafm.com/index.php/products/operating-software/park-smartscan
[14] Layton, B.E. and A.M. Sastry, Acta Biomater. 2 (2006) 595-607.
[15] Gautieri, A., et al., Nano Lett. 11 (2011) 757-66.
[16] Grant, C.A., et al., Biophys. J. 11 (2009) 2985-92.