


Surface Potential Imaging via Sideband Kelvin Probe Force Microscopy
Armando Melgarejo, Ben Schoenek, and Byong Kim
Technical Services, Park Systems, Inc., USA
Introduction
From materials science to biological research, scientists have adopted Kelvin Probe Force Microscopy (KPFM) to measure surface potential and work functions. KPFM follows the Electrostatic Force Microscopy (EFM) operation principle. It measures a contact potential difference (CPD) and determines the sample's work function using DC bias feedback. However, conventional Off-resonance KPFM produces low spatial resolution and low signal-noise ratios due to long-range crosstalk caused by the interaction between the sample and the total body of the cantilever. Sideband KPFM has an unparalleled spatial resolution and centers on the local interaction between the tip apex and sample, making it useful for analyzing grain boundaries, semiconductor junctions, photovoltaics materials, and even molecular structures [1-3].
KPFM operates by measuring the CPD. CPD is an electrostatic potential that exists between samples of two dissimilar, electrically connected materials. Considering the atomic force microscopy (AFM), the two different materials are the AFM tip and the sample. Each one of the materials has a specific conduction band and a separate work function. The work function of a material is the amount of energy required to remove an electron to infinity from the surface of a given solid [2].
If the tip and the sample are electrically connected, the electrical connection will induce a natural flow of electrons and will create a potential difference between the two materials (Figure 1). This potential difference is measurable by applying the theoretical formula of contact potential difference:

where ϕtip & ϕsample are the work function of the sample and tip, respectively, and “e” corresponds to the electronic charge. Obtaining the work function of the material is possible by multiplying the surface potential of the materials by a single electron charge.
Equation (1) can be explained using the Kelvin Probe method, which relies on detecting the electric field of the materials composing the AFM tip and sample. By modifying the voltage CPD, the electric field varies. Thereby, when applying an external bias (VDC) of the same magnitude to the AFM tip but opposite direction, the surface charge of the contact area nullifies. Once there are no electrostatic forces, the work function difference has the same value as the applied voltage CPD; consequently, the work function of the sample can be calculated if the work function of the tip is known (Equation (2)) [3].

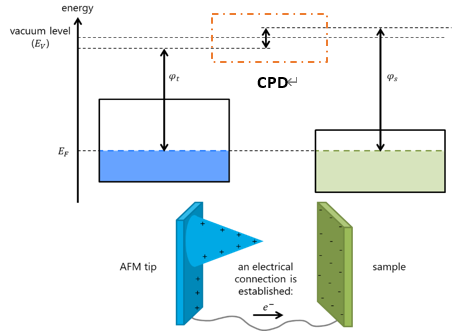
Figure 1. Contact Potential Difference between an AFM tip and sample.
Off-resonance KPFM
When considering the AFM tip and the sample as a capacitor, analyzing the electrostatic forces between them is straightforward, as the amount of energy can be calculated with the difference in voltage and the capacitance. KPFM uses two frequencies to acquire topography and surface potential simultaneously. The standard procedure for KPFM consists of using two lock-in amplifiers (Figure 2A). The first lock-in amplifier modulates the frequency used to oscillate the cantilever at its mechanical resonant frequency, using a piezoelectric material to obtain a topography image. The second lock-in amplifier regulates the frequency, generally at 17 kHz, to measure the surface potential. This technique is denoted “Off-resonance KPFM,” as we can theoretically choose any resonance frequency as long as it does not match the cantilever's mechanical resonance [2]. Additionally, Off-resonance KPFM gets the surface potential information by measuring the total interaction of the complete cantilever with the sample, limiting its spatial resolution.
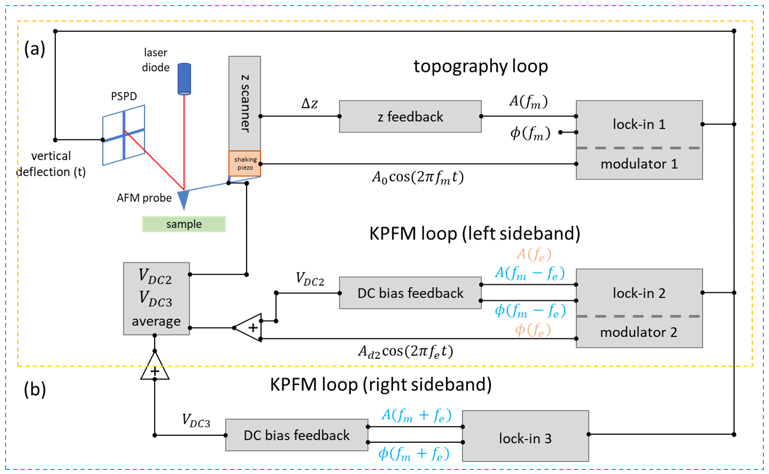
Figure 2. Sideband KPFM feedback loop. a) Off-resonance KPFM Loop. b) Sideband KPFM Loop.
Sideband KPFM
Sideband KPFM is a technique that exploits the intermodulation of an electrostatic drive force and a mechanical drive force to upconvert the electrostatic frequency to the first flexural resonance, where the high Q “quality factor” yields a more sensitive measurement [3]. Additionally, Sideband KPFM signal is calculated by using a local interaction between the tip apex and the sample rather than a total interaction between the cantilever and the sample, improving the spatial resolution over Off-resonance KPFM. Local interaction allows the system to measure the surface potential of localized features with high resolution, due to the reduced interaction with other parts of the cantilever. The reason for the substantial reduction of the interaction, induced by the cantilever and the tip, is the downward distance dependence of the lever and cone forces on the experimentally important range [1].
The electrical driving frequencies of Sideband KPFM appear at the sidebands of the mechanical oscillation of the cantilever (Figure 3), reducing the long-range crosstalk [3]. The sideband frequencies of the mechanical oscillation and the local interaction of the tip apex allow Sideband KPFM to accurately measure the surface potential with an increased resolution compared to Off-resonance KPFM.
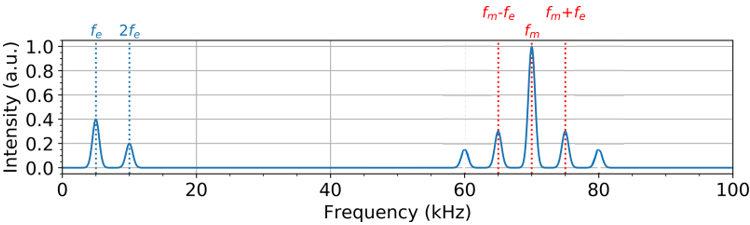
Figure 3. Fourier Transform of the vertical deflection comparing Off-resonance KFPFM vs Sideband KPFM.
When performing Sideband KPFM, instead of using a frequency of 17 kHz, the KPFM mode works with the sideband’s frequencies, usually 1-5 kHz Off from the cantilever’s mechanical resonance. This method uses two lock-in amplifiers (Figure 2B) to lock on the sideband frequencies. Figure 2B shows that the second lock-in amplifier modulates the left sideband, while the third modulates the right sideband. The surface potential is obtained by averaging the DC voltage feedback from both sideband frequencies [1].
EFM Amplitude Sensitivity
The KPFM signal-to-noise ratio reflects the magnitude of the electrostatic interaction, or Electrostatic Force Microscopy (EFM) amplitude sensitivity. The higher the EFM amplitude sensitivity, the higher the KPFM signal-to-noise ratio response can be. The EFM amplitude sensitivity can be defined as ΔEFM amplitude / Δ tip bias. When the cantilever’s resonance frequency equals the electrical driving frequency, the EFM amplitude can be defined as:

where X is the amplitude of the cantilever displacement, Q is the cantilever’s Q factor, and “k” is the spring constant of the cantilever. Thereby, the EFM amplitude is directly proportional to the VAC and inversely proportional to the cantilever’s spring constant. Another factor that affects the EFM amplitude sensitivity is the laser displacement on the photo detector (Δa) [4]. It is defined as:
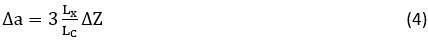
where Lx is the distance between the tip and the cantilever, Lc the cantilever’s length, and ΔZ the displacement of the cantilever oscillation. Therefore, the longer the cantilever, the smaller the displacement. The EFM amplitude sensitivity, thus the KPFM signal sensitivity, increases when the cantilever has a short length and/or a small spring constant [4].
F14H20
KPFM not only measures the CPD on metals or semiconductors, but it can also measure the surface potential of organic or soft samples like the self-assembled molecules of some alkanes. Eicosylperfluorotetradecane, F(CF2)14(CH2)20H, or its abbreviated form F14H20, is a semifluorinated alkane with a perfluorinated chain segment. It consists of two incompatible subunits that segregate into distinct domains. The mismatch in the cross-section between the perfluoro and the perhydro alkyl tail result in distinctive superstructure formations (Figure 4). The mechanism on how these compounds order in specific polymorphism is yet not fully understood. The investigation of semifluorinated alkanes, such as F14H20, contributes to self-assembly knowledge [5].
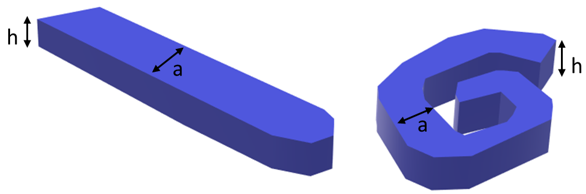
Figure 4. Schematic pictures of the ribbon and the spiral morphology for F14H20
Experimental
In this study, a Park NX10 AFM system, equipped with SmartScanTM software, measures the local contact potential difference and topography of F14H20 molecular structures. The study shows a comparison between Sideband KPFM and conventional Off-resonance KPFM image resolution. For the Sideband KPFM experiments, lock-in amplifiers send a 3 kHz AC signal to the cantilever, while the standard technique uses a 17 kHz AC signal. SmartScan automatically selects the phase and amplitude of the resonances. For these experiments, the average signal of both sidebands is recorded. Two different types of conductive cantilevers, NSC14/Cr-Au and NSC36-C/Cr-Au, are used to analyze the correlation between EFM amplitude sensitivity, the cantilever’s length, and the spring constant. NSC14/Cr-Au and NSC36-C/Cr-Au are 125 and 130 μm long and have a spring constant of 5 and 0.6 N/m, respectively.
Results
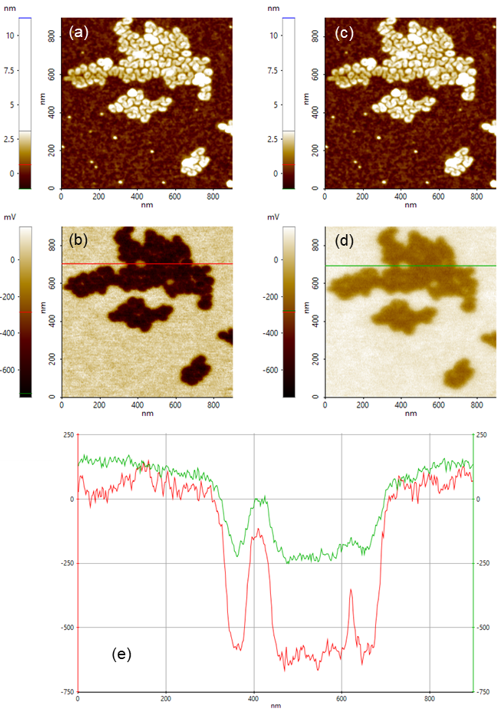
Figure 5. Sideband and Off-resonance comparison. (a) Sideband topography image. (b) Sideband surface potential image. (c) Off-resonance topography image. (d) Off-resonance surface potential image. (e) Line profiles taken along red line in (b) and along green line in (d).
Figure 5 shows a surface potential comparison between Sideband and conventional Off-KPFM images obtained with a NSC36-C/Cr-Au cantilever. The Sideband KPFM measurement of the F14H20 aggregates shows a surface potential contrast of 600-650 mV between the fluorinated parts of the molecules and the substrate, along with a clear lateral resolution where even the in-between space of the aggregates is distinguished. Looking at the conventional Off-resonance KPFM measurements, the image shows that the technique successfully measures the potential difference of the aggregates and the substrate; however, the potential difference gives a value of 300 mV. The spatial resolution is not as well defined. The improvement of resolution when using the Sideband mode relies on the local interaction between the tip apex and sample. The topography images indicate that the F14H20 aggregates of this sample form an incomplete spiral superstructure (Figure 5). These incomplete spirals tend to form more compacted superstructures, reducing the in-between spaces of the aggregates [5].
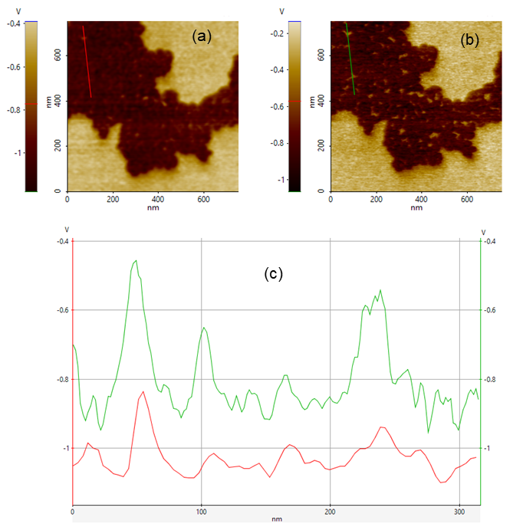
Figure 6. Surface Potential Difference of F14H20 via Sideband KPFM. (a) Surface Potential imaged with probeNSC14/Cr-Au. (b) Surface Potential imaged with probe NSC36C/Cr-Au. (c) Line profiles taken along redline in (a) and green line in (b).
Figure 6 shows the results of the correlation between the spring constant of the cantilever and KPFM signal-to-noise ratio sensitivity. Cantilever NSC36-C/Cr-Au (Figure 6b) shows a higher sensitivity for the surface potential changes than the cantilever NSC14/Cr-Au (Figure 6a). Line profiles taken from both images, shown in Figures 6a and 6b, demonstrate that using either type of cantilever tip allows Sideband KPFM to detect small changes on the surface potential, even in-between the F14H20 superstructures. The fact that NSC36-C/Cr-Au shows a higher KPFM signal sensitivity and has a spring constant that is almost ten times smaller than NSC14/Cr-Au indicates a correlation between the spring constant of the probe and the sensitivity. Equation 4 establishes that the length of the cantilever is also crucial for EFM amplitude sensitivity; both cantilevers have almost the same length, so the correlation between cantilever length and EFM sensitivity is not analyzed. Further experiments are needed to investigate the correlation between the cantilever's length, the EFM amplitude, and the KPFM signal sensitivity.
Summary
In this study, Sideband Kelvin Probe Force Microscopy on a Park NX10 atomic force microscope is used to image F14H20 molecular structures. This study validates that Sideband KPFM is a technique that measures the surface potential with higher sensitivity and spatial resolution compared to the conventional Off-resonance KPFM techniques. The results suggest a correlation between KPFM signal sensitivity and the cantilever spring constant, and that a lower spring constant of the cantilever yields higher sensitivity than stiffer cantilevers. Further study is necessary to understand the correlation between KPFM signal sensitivity and cantilever length.
References
1. Park Systems Application Technology Center. A Comparative Study of Atomic Force Microscopy between AM-KPFM and Sideband KPFM, Principles and Applications,
https://parksystems.com/images/media/appnote/AppNote-61_sideband-KPFM_A-comparative-study.pdf
2. H. Seo, D. Guo, and G. Jung, How to obtain sample potential data for KPFM measurement. Park Systems Corporation,
https://parksystems.com/images/media/appnote/How-to-obtain-sample-potential-data-for-KPFM-measurement-18.pdf
3. A. Cerreta, et al. Exploring the Potential of the Sideband KPFM Mode. Park Systems Webinar,
https://parksystems.com/medias/nano-academy/webinars/115-webinars/1850-exploring-the-potential-of-the-sideband-kpfm-mode-april-9-2020
4. T. Fukuma, et al. Development of low noise cantilever deflection sensor for multi environment frequency modulation atomic force microscopy. Review of Scientific Instruments, Vol 76, (2005): 1-8.
5. A. Mourran, et al. Self-Assembly of the Perfluoroalkyl-Alkane F14H20 in Ultrathin Films. Langmuir, Vol 21, (2005): 2308-2316.