


Several Atomic force microscopy (AFM) modes are available to characterize mechanical properties on a large variety of samples, including phase imaging via Tapping mode, PinPoint nanomechanical mode, Force distance (FD) spectroscopy, Force modulation microscopy, and Nanoindentation. Besides these modes that use the out-of-plane deflection of the cantilever for material characterization, detection of the in-plane frictional forces can resolve material-specific mechanical properties of a sample. In AFM, frictional properties can be investigated via Lateral force microscopy (LFM). LFM can be used to study differences in material compositions on coating layers, lubricant properties, strength of adhesion on patterned structures and so on.
The working principle of LFM is based on contact mode AFM. However, whereas in contact mode we measure the bending of the cantilever in the vertical direction to gather topographical information, LFM monitors the vertical deflection for topographical information and the torsion of the cantilever in the lateral direction for frictional information. Hence, the detected movement of the AFM tip in LFM is perpendicular to the length of the cantilever. The lateral torsion of the cantilever is a result of the friction force acting on the cantilever as it scans across the sample surface. The magnitude of this torsion is determined by the frictional coefficient between the AFM tip and the sample, the topography of the surface, the scan direction, and the cantilever’s lateral spring constant. LFM is especially useful to study the heterogeneous sample compositions. Here, LFM images the distribution of materials in real space with a nanoscale resolution.
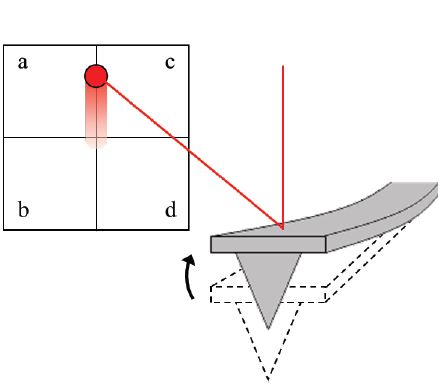
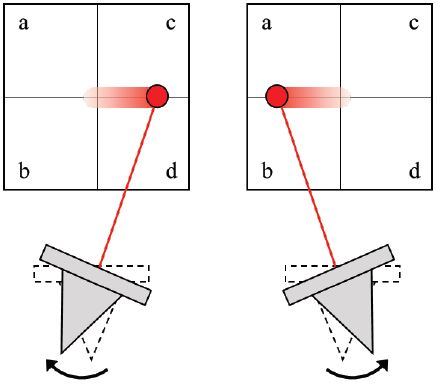
Figure 1. Schematic drawing of the beam spot position on the PSPD due to (a) the vertical cantilever deflection for topography imaging and (b) the lateral cantilever torsion for LFM imaging.
Since LFM measures the cantilever displacement in the lateral as well as the vertical direction for simultaneous friction and topography imaging, it uses a position-sensitive photo detector (PSPD) with four domains (quad-cell), as shown in figure 1. Generally, in AFM, the topography of a sample surface is measured via the “bi-cell” signal of the quad-cell PSPD, commonly called vertical signal (A-B). This signal originates from the difference between the upper cells (a+c) and the lower cells (b+d) of the quad-cell PSPD, as shown in figure 1.
Topography information = (a+c) – (b+d)
The LFM signal, which directly relates to the change in the surface friction, corresponds to the lateral torsion of the cantilever and is given as the difference between the left cells (a+b) and the right cells (c+d).
Frictional force information = (a+b) – (c+d)
In LFM, the edges of topographic features on the sample surface as well as different materials in a heterogeneous sample can introduce a contrast, as shown in figure 2. Since the LFM signal is affected by both material frictional coefficient and topographic features, understanding their contributions to the LFM data is important. Figure 2 shows how the cantilever displacement changes due to material friction and topography.
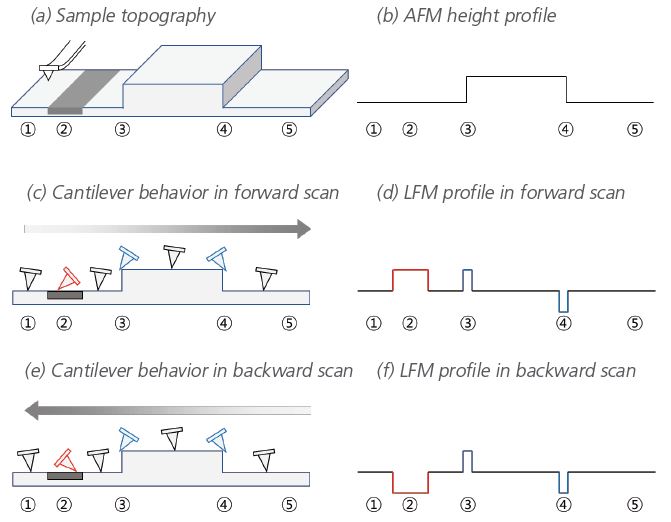
Figure 2. Representation of the cantilever displacement and LFM signal caused by topographic features and material contrast. The surface structure of the sample (a) and the corresponding topography profile from the vertical cantilever deflection (b). The gray-shaded area in (a) represents a different material composition with a friction contrast. The lateral cantilever torsion during the forward scan (c) and the corresponding LFM signal (d). The lateral cantilever torsion during the backward scan (e) and the corresponding LFM signal (f). (d) and (f): LFM signal caused by topographic feature are shown in blue, LFM signal caused by material contrast is shown in red.
Figure 2 (a) shows a plane sample with an angular protrusion as the only topographic feature on an otherwise smooth surface. The edges of the features are labeled as region (3) and (4). The gray-shaded area labeled with the number (2) represents a different material composition with a relatively high frictional coefficient. The AFM height profile, which corresponds to the vertical deflection of the cantilever is shown in (b). Figures 2 (c) and (e) display the cantilever behavior as it encounters the topographic feature as well as the area with a different scanning from left to right (forward) and right to left (backward), respectively. Profiles of the LFM signal in forward and backward scan direction are shown in (d) and (f), respectively. Changes in the lateral torsion of the cantilever due to the contrast in the frictional force between the AFM tip and the sample are highlighted in red in region (2). This region (2) is indistinguishable from area (1) in the height signal. However, there is a distinct contrast in the LFM signal. When scanning forward, an increase in relative frictional coefficient will cause the cantilever to tilt to the right side, thus producing an increase in the LFM signal. In contrast, when the scan direction is reversed, the cantilever will tilt to the left side, yielding a decrease in the LFM signal in this area.
Regions (3) and (4) in figure 2 mark the edges of a topographic feature, which affects the LFM signal due to the height change of the sample surface. During scanning, the protrusion with the steep edge will twist the cantilever. This twist results in an increase of lateral signal as seen at point (3) in figure 2 (d) and (f). Similarly, the LFM signal decreases, when the probe encounters the downward step as depicted at point (4). However, it should be noted that the topography-induced LFM signal in regions (3) and (4), highlighted in blue, maintains the same tilting direction of the cantilever regardless of the scan direction. Therefore, it is possible to distinguish between the LFM signal caused by topography features and the LFM signal caused by the difference in frictional signal due to material heterogeneities by comparing the forward and backward LFM scans. Moreover, the topography effect can be minimized by subtracting the LFM forward signal from LFM backward signal or vice versa.
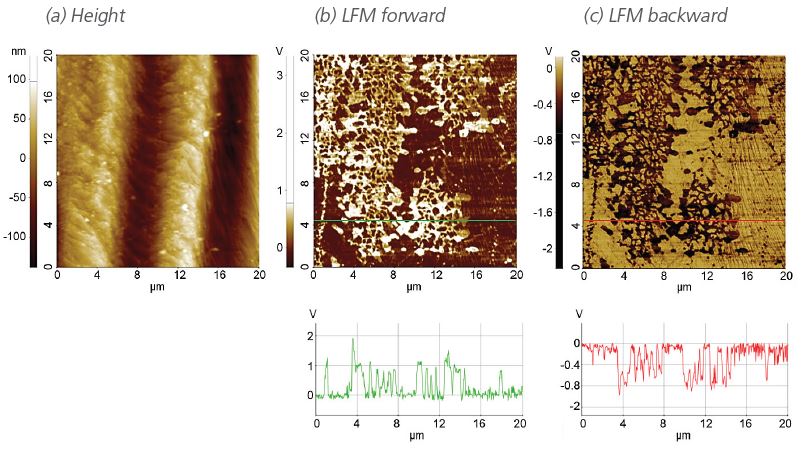
Figure 3. LFM measurement of a graphene layer on a copper substrate. (a) AFM height featuring only the copper terraces, (b) LFM image and line profile of forward scan and (c) LFM image and line profile of backward scan clearly show the friction contrast between graphene and copper.
An exemplary LFM measurement on an inhomogeneous surface is shown in figure 3. The sample consists of graphene on copper. The different materials cannot be distinguished from the height image because the coated graphene is too thin to be detected on the rough copper substrate. However, LFM mode is ideally suited to detect the coated area of graphene on the copper substrate. The LFM forward and backward scan in (b) and (c) clearly distinguish the graphene layer and the copper substrate (the graphene layer covered area: bright color in LFM forward (b) and dark color in LFM backward (c)). Both signals feature a distinct materials contrast in the images as well as the line profiles, extracted at the green and red line. As expected, the contrast is inverted for the forward and backward scan confirming that the contrast originates from a difference in the friction force and therefore reflects the distribution of the materials.
Figure 4 shows a LFM measurement on a silicon surface with a lubrication layer to study the uniformity of that coating layer. While the height image displays no contrast between lubricant-coated area and non-coated area, the LFM information clearly features the inhomogeneous distribution of the lubricant. The distinct contrast inversion of the forward and backward scan confirms that the LFM contrast is caused by material differences.
LFM measurement can also be used to distinguish SiO2 layers from a Si substrate after lithography. Figure 5 shows oxidation patterns created on a bare Si surface by anodic oxidation lithography. The oxidation layer thickness is 1 ~ 2 nm in height and the pattern can be observed in both height and LFM images. However, compared to the weak contrast of the height image, LFM features a clear friction difference between the Si substrate and the oxide pattern.
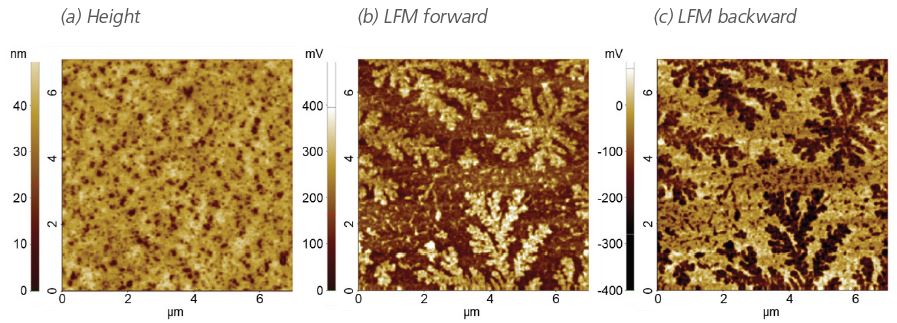
Figure 4. LFM measurement on an inhomogeneously lubricant-coated Si substrate (a) AFM height displays not material contrast, (b) LFM image scanned in the forward direction and (c) LFM image scanned in the backward direction showing the inverted friction contrast for the different materials.
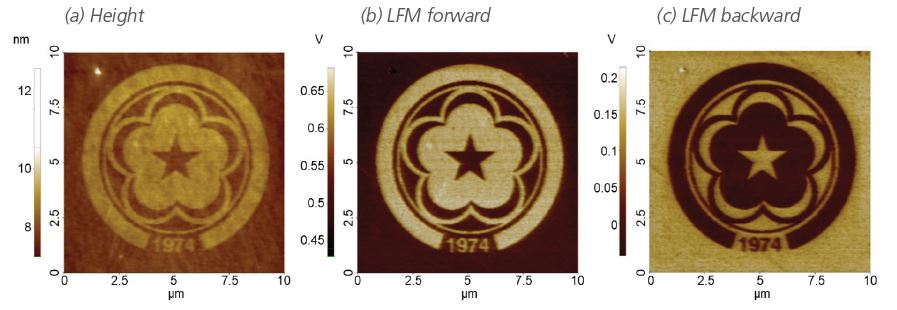
Figure 5. LFM measurement on a SiO2 patterns on Si substrate prepares via anodic oxidation nanolithography. (a) AFM height with a weak contrast, (b) LFM image scanned in the forward direction and (c) LFM image scanned in the backward direction with a clear inverted friction contrast.