FX40 with monitor

Contact Mode

The Simplest Scanning Method to Image the Surface

The contact mode is the simplest way to acquire the sample topography. The topography signal comes from the Z scanner position, which maintains the deflection of the cantilever constant on the sample surface.

Contact mode is a standard imaging mode of Atomic Force Microscopy (AFM) that can obtain topographic information on a wide range of sample types.

Contact mode is a standard imaging mode of Atomic Force Microscopy (AFM) that can obtain topographic information on a wide range of sample types. In contact mode, feedback is typically obtained through cantilever bending, which employs a low spring constant to minimize sample damage. During contact mode imaging, as the scanner traces the tip across the sample, the repulsive contact forces between the tip and the sample bend the cantilever. This bending accommodates changes in topography, as depicted in Figure 1 (a). For more details, please refer to the Lennard-Jones potential curve in Figure 1 (b), which represents the distance dependence of tip-sample interactions. As the outermost atoms of the tip and the sample are gradually brought closer, they start to attract each other weakly. This attractive force increases until the inter-atomic distance is small enough to trigger the Pauli repulsion between their electron clouds. As the distance between atoms continues to decrease, strong repulsion swiftly counteracts the attractive force. A balance of these interatomic forces is achieved when the distance between the atoms is reduced to a few angstroms, about the length of a chemical bond.

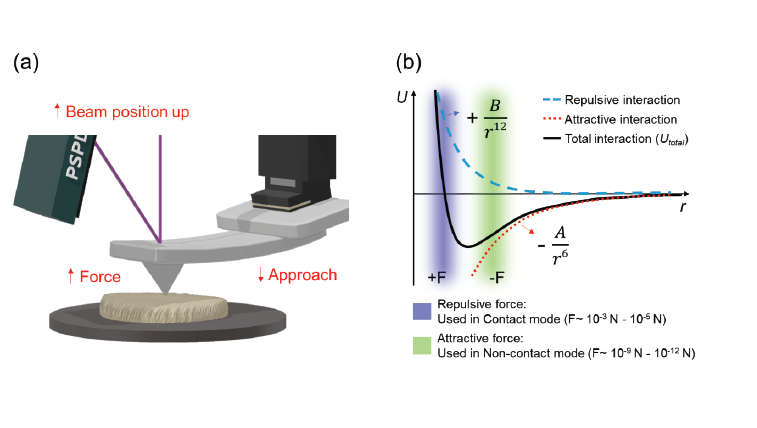
Figure 1. (a) Cantilever bending due to the repulsive contact forces and (b) inter-atomic interaction potential U vs. distance r. The blue curve represents a purely repulsive interaction, while the red curve represents a purely attractive interaction. The black curve is a combination of long-range attractive and short-range repulsive interaction forces called the Lennard-Jones potential. At larger distances, the net force is attractive (-F), which switches to a net repulsive force (+F) when two atoms are brought closer together.

When the outermost atoms of tip and sample are gradually brought closer, they start to weakly attract each other. This attractive force increases until the inter-atomic distance is small enough to trigger the Pauli repulsion between their electron clouds. The strong repulsion quickly offsets the attractive force as the inter-atomic distance continues to decrease. The inter-atomic forces are balanced when the distance between the atoms is reduced to a few angstroms, about the length of a chemical bond. The atoms are in contact when the total inter-atomic force becomes positive (repulsive interaction regime). As shown in Figure 1 (b), the slope of the interaction potential curve is relatively steep in the repulsive regime (U ∝r-12). As a result, the repulsive force superimposes the attractive van der Waals forces. An upward bending of the cantilever, increasing with higher force setpoints, indicates the repulsive regime of tip-sample interaction. A high force setpoint may cause damage to the surface or wear to the tip, depending on the nature of the cantilever and the sample. In contact mode, the cantilever exerts a force normal to the surface, and the deflection of the cantilever is proportional to the force applied. When subjected to small deflections, the cantilever can be considered a Hookean spring with spring constant k (units N/m). The magnitude of the cantilever force hinges on the spring constant of the cantilever and the setpoint, which is the reference force for feedback selected by the operator. At a given tip-sample separation, the only variable force is the cantilever force. The spring constant of a cantilever can be determined easily on Park AFMs using the thermal tune method. With a known spring constant, the deflection measured (usually in nanometers) can be directly converted to force.

Park AFMs detect the deflection of the cantilever via an optical beam deflection technique. Figure 2’s schematic diagram shows how an optical beam from the superluminescent diode (SLD) reflects from the back of the cantilever onto a position-sensitive photodetector (PSPD). As the cantilever bends, the position of the beam on the PSPD shifts. A geometric amplification is produced by the ratio of the optical path length, from the cantilever and the detector, to the cantilever length. As a result, the system can detect sub-angstrom vertical movements of the cantilever.

Figure 2. Schematic diagram of an experimental setup for contact mode AFM. Cantilever deflection from the default (setpoint) position is registered as a shift of the optical beam spot on the PSPD. The error signal is used as feedback for the Z scanner motion to restore the setpoint value. Z scanner’s response to the error signal is recorded as the topography image (while scanning in x- and y-direction).

During contact mode scanning, the deflection of the cantilever is kept constant at a target value (so-called setpoint). A Z scanner feedback readjusts the height of the Z scanner to maintain the setpoint. In contact mode, the error signal in contact mode reflects the difference between the setpoint and the vertical displacement of the beam spot on the PSPD, serving as input for the feedback (see Figure 2). A schematic diagram of contact mode measurement is shown in figure 3. Based on the error signal, the feedback changes the Z scanner position to accommodate the topography change. The AFM topography is then generated based on the motion of the Z scanner. Since the cantilever deflection is kept constant during measurement, the total force applied to the sample is constant as well. In Contact mode, the scanning speed in contact mode is determined by the Z scanner feedback, which follows the topography. To achieve high-speed contact imaging with optimal quality, Park AFMs employ a high-speed Z scanner and a low noise signal processing controller.

Figure 3. Schematic diagram of the experimental setup for tapping mode. The phase shift between the detected cantilever oscillation and the drive signal gives a contrast between different materials and therefore carries additional information on the material distribution in the sample.

An example of contact mode imaging is presented in figure 4. In-situ contact mode AFM in liquid was used to monitor the morphology change of calcite crystal growth. The (104) cleavage plane of calcite was imaged in a 45 μm by 45 μm overview scan right after the exposure to the Ca(OH)2 solution, as shown in figure 4 (a). Subsequent 500 nm by 500 nm scans in contact mode captured the calcite surface’s crystal growth over 60 minutes in the Ca(OH)2 solution.

Figure 4. (a) AFM height of overview scan on the (104) calcite crystal plane, and (b) detail scans for in-situ imaging of calcite crystal growth in dependence of the exposed time to Ca(OH)2 solution.

While scanning in contact mode, the cantilever applies substantial shear forces, potentially damaging the samples and/or the tip apex. Particularly delicate samples, such as adsorbed molecules, biological samples, and soft polymers, benefit from the non-contact mode for topography imaging. Since non-contact mode operates in the attractive force regime, shear forces are avoided, which significantly increases the tip lifetime. Hence, non-contact mode is generally recommended for topography imaging (refer to “Non-contact mode note” for more details). Nonetheless, various advanced AFM techniques have been developed on the basis of contact mode, as they require a constant tip-sample contact to measure additional surface properties, including conductivity, resistance, capacitance, piezoresponse, and thermal behavior.