


Research Application Technology Team, Park Systems HQ.
Introduction
Recently, Atomic Force Microscopy (AFM) has become a powerful tool in both research and industry. AFM, the most widely used technique in Scanning Probe Microscopy (SPM), employs a sharp tip to measure the sample’s topography at the nanoscale. Moreover, various optional modes enable simultaneous measurements of electrical, mechanical, and other material properties along with topographical information.
Among these modes, several are dedicated to investigating mechanical properties. Typically, the PinPoint™ (Hereafter referred to as ‘standard PinPoint’) mode [1] is used to measure soft and delicate samples which are easily damaged by general scan such as Contact or Tapping. In addition, it allows quantitative analysis of mechanical parameters such as adhesion and Young’s modulus. During measurement, the Z scanner moves vertically at each pixel to induce elastic deformation, while the system records force-distance (F/d) curves during the approach-retract cycle. From these data, surface morphology, roughness, stiffness, adhesion force (energy), and Young’s modulus can be quantitatively determined.
However, the PinPoint mode is limited by its relatively long imaging time. In this mode, the XY scanner performs a horizontal stepwise motion at each pixel while the Z scanner alternates between approach and retract to acquire F/d curves. Although this “stop-and-go” operation enables precise quantitative measurement, it significantly reduces scanning speed, Table 1(a). To overcome this limitation, the Fast PinPoint mode has been developed to dramatically improve scanning speed while maintaining quantitative accuracy.
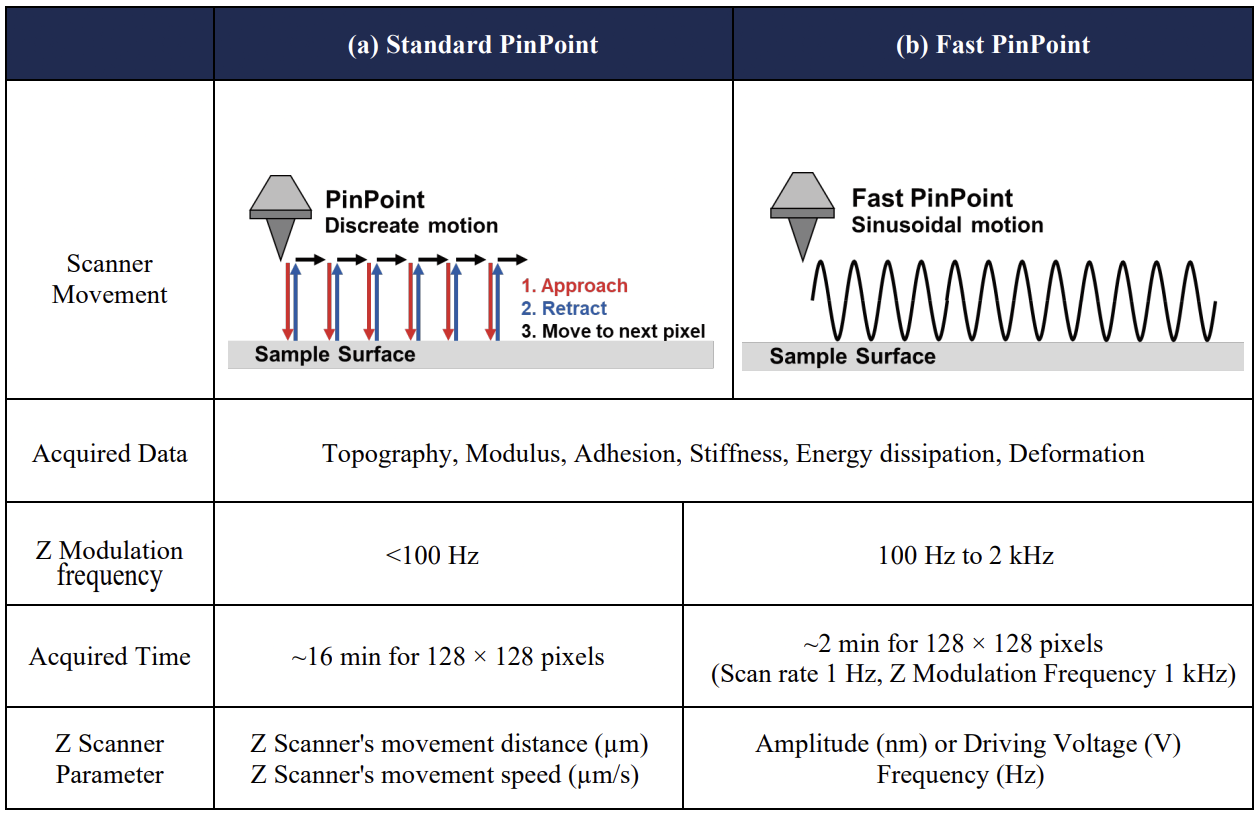
Table 1. Comparison of standard PinPoint and Fast PinPoint
In this mode, the Z scanner follows a continuous sinusoidal waveform, while the XY scanner moves linearly, as illustrated in Table 1(b). This innovative approach allows researchers to measure mechanical properties more efficiently without sacrificing data reliability.
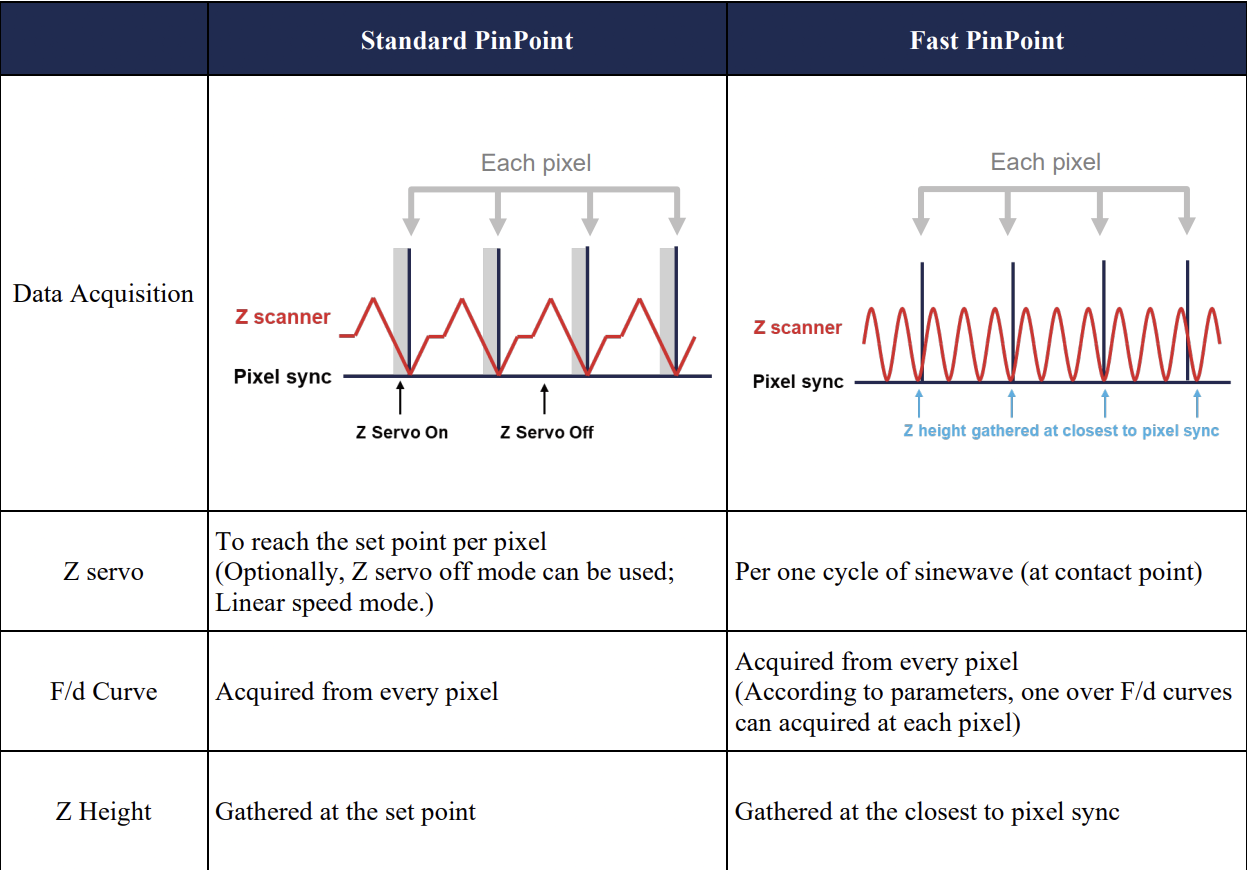
Table 2. Data Acquisition method in standard PinPoint and Fast PinPoint
Table 2 summarizes the operational differences between the PinPoint and Fast PinPoint modes. In the standard mode, the XY scanner pauses at each pixel while the Z scanner performs approach-retract cycles, ensuring accurate force control but resulting in slow imaging. In contrast, the Fast PinPoint mode replaces the discrete step motion with a continuous sinusoidal Z scanner trajectory synchronized with a linear XY scan. The Z height is recorded at the moment closest to pixel synchronization, effectively capturing full F/d curves during each oscillating cycle.
Consequently, the Fast PinPoint mode significantly reduced total scan time while maintaining quantitative precision. Thus, while both modes provide reliable nanomechanical information, the Fast PinPoint mode offers a clear advantage in measurement efficiency by transforming the Z scanner motion from discrete to continuous operation.
Method
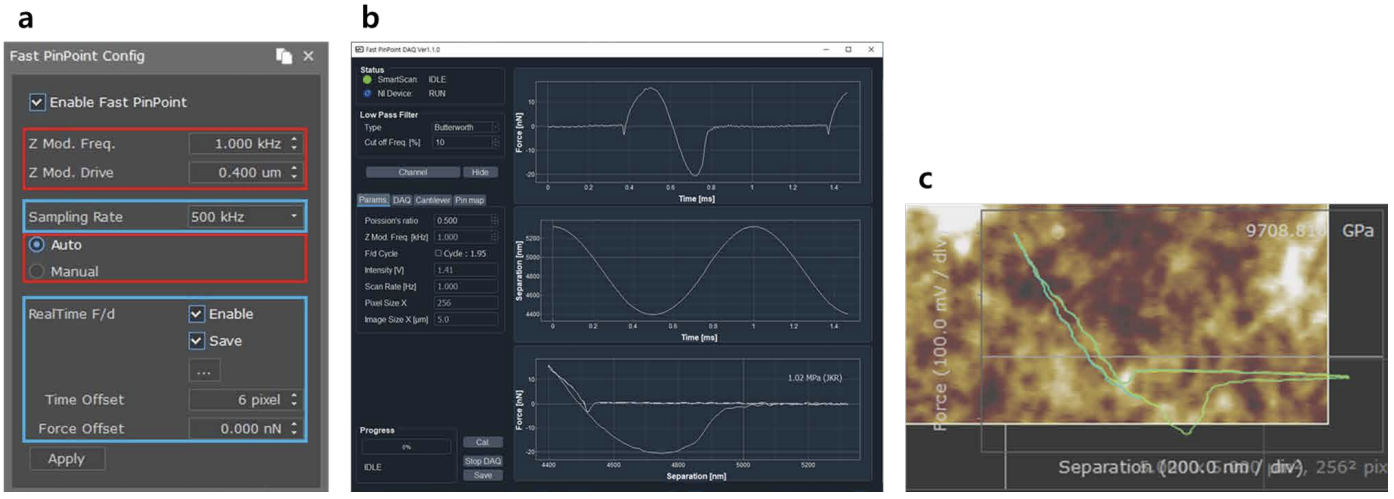
Figure 1. (a) Configuration window of the Fast PinPoint mode in the SmartScan™ software. The parameters highlighted in red are used for both NX and FX systems, while the parameters highlighted in blue are specific to the FX system. (b) External control window, Fast PinPoint DAQ, for the Fast PinPoint mode on the NX system. (c) Realtime F/d curve of FX Fast PinPoint mode display on SmartScan™. FX systems have embedded DAQ board in their controller, therefore they need not use extra hardware (NI-board) and software.
Compared to the standard PinPoint mode, the Fast PinPoint mode requires slightly different parameter settings. In Fast PinPoint mode, the Z scanner oscillates during measurement, and therefore the user must define the Z modulation frequency and modulation drive. Fig. 1 (In Figure 1a, the Z modulation drive is a parameter that determines the amplitude of the Z scanner's oscillation, and its unit can be set to µm.).
The Z modulation frequency, which can be set up to 2 kHz, is the most critical parameter in determining the number of F/d curves acquired per pixel. Unlike the standard PinPoint mode, which collects one F/d curve per pixel, the number of F/d curves obtained in Fast PinPoint mode varies depending on the selected frequency.
During the measurement, the Z scanner performs sinusoidal motion, and F/d curves are continuously collected at all contact points where the probe interacts with the sample surface. For each pixel, the system selects the F/d curve that is closest to the pixel sync point to calculate the local mechanical properties. (All acquired F/d curves are saved in a PS-PPT file for further analysis.)
Since the F/d curves are saved continuously during scanning, users must carefully set parameters such as scan rate, pixel density, and Z modulation frequency so that at least one F/d curve is obtained within each pixel. If fewer than one F/d curve is assigned to a single pixel, interpolation may occur between adjacent pixels because an F/d curve from the previous pixel may be used for the next one. This issue can be easily avoided by setting parameters so that each pixel contains at least one or more F/d curves.
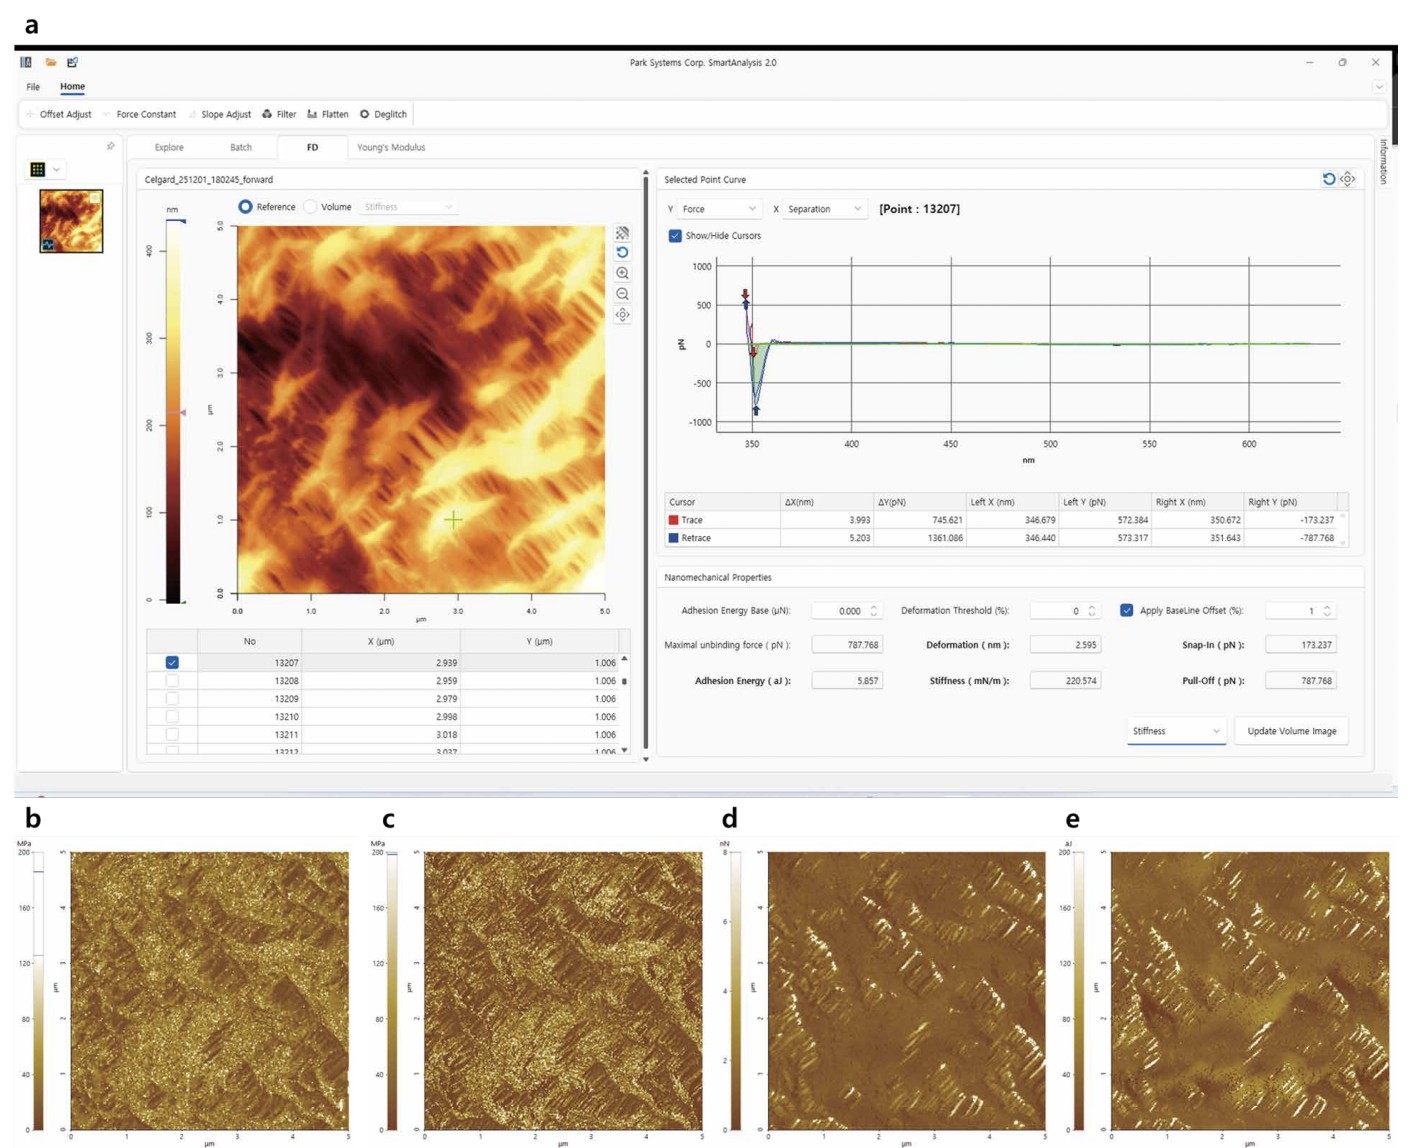
Figure 2. (a) Smartanalysis™ interface used to load and analyze .ps-ppt files containing F/d curves acquired in Fast PinPoint mode. Mechanical property maps can be generated in the FD tab (e.g., deformation, stiffness, and other mechanical properties) while modulus maps are processed in the Young’s modulus tab. (b, c) Modulus images calculated using different contact mechanics models; (b) Hertz and (c) JKR. (d, e) Adhesion-related property maps; (d) adhesion force and (e) adhesion energy. Additional channels such as stiffness, snap-in, and deformation can also be generated within the software.
All acquired force–distance (F/D) curves are stored in a ‘.ps-ppt’ file, which is the standard data format used in both standard PinPoint and Fast PinPoint modes. These files can be directly opened in SmartAnalysis™ for post-processing.
Within SmartAnalysis™, mechanical property maps – including deformation, modulus, and stiffness – can be generated from the collected F/D curves using the software’s built-in analysis tools. After generating the property images, users may export the results in standard ‘.tiff’ format for further visualization, reporting, or integration with additional analysis workflows.
Experimental
PS/LDPE (2 polymers blended; PS and LDPE) sample was imaged with Park NX10 AFM using Fast PinPoint mode. A cantilever Scout 150, with a nominal resonance frequency of 150 kHz and a nominal spring constant of 18 N/m, was utilized to measure the PS/LDPE sample, Fig 3a (cantilever information; SEM image (shape) and cantilever properties). The other one, PPP-FMR, with a nominal resonance frequency of 75 kHz and a nominal spring constant of 2.8 N/m, was used to acquire a topographical image of the celgard sample, Fig 3b. Images acquired in Fast PinPoint mode are generated by assigning information from the continuously collected F/d curves – obtained as the Z scanner oscillates at several kHz – to each pixel. The feedback mechanism is the same as in contact mode to control the Z scanner movement.
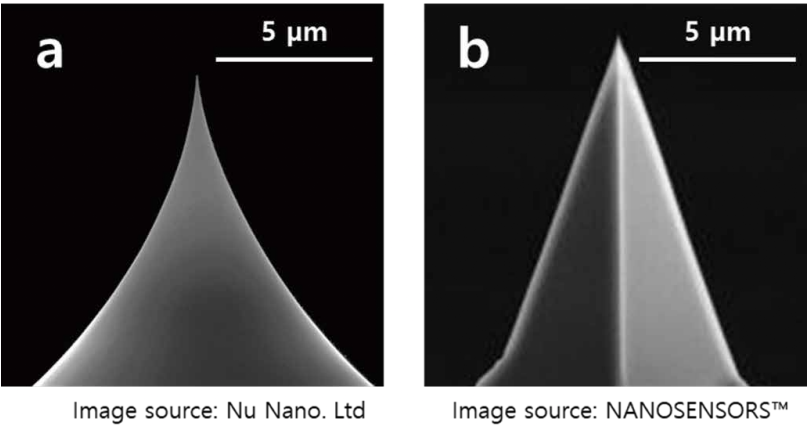
Figure 3. (a) SEM image of Scout150 AFM probe (Nu Nano. Ltd.) (b) SEM image of PPP-FMR AFM probe (NANOSEMSORS)
All acquired force–distance (F/D) curves are stored in a ‘.ps-ppt’ file, which is the standard data format used in both standard PinPoint and Fast PinPoint modes. These files can be directly opened in SmartAnalysis™ for post-processing.
Within SmartAnalysis™, mechanical property maps – including deformation, modulus, and stiffness – can be generated from the collected F/D curves using the software’s built-in analysis tools. After generating the property images, users may export the results in standard ‘.tiff’ format for further visualization, reporting, or integration with additional analysis workflows.
Results and Discussion
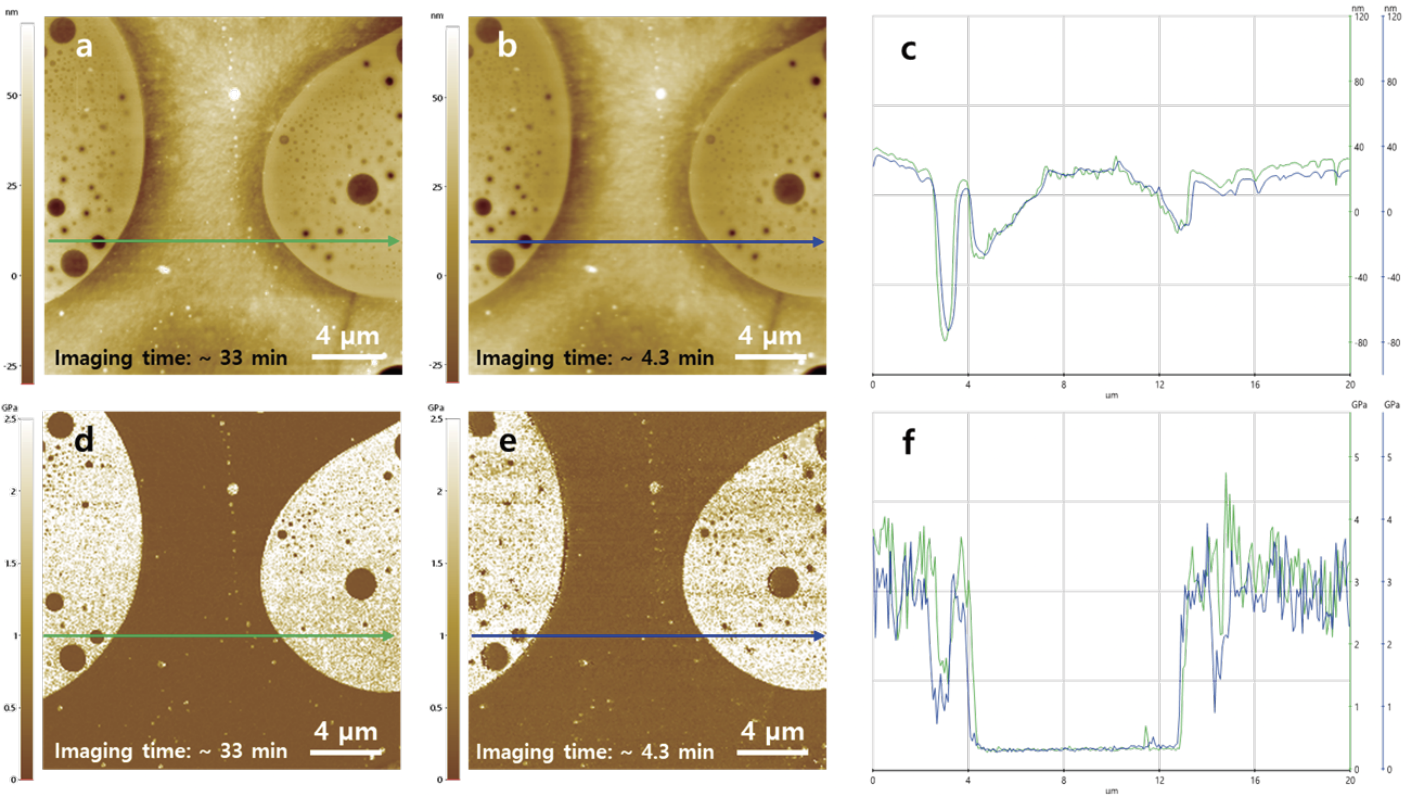
Figure 4. (a) and (d) show AFM images of the PS/LDPE sample obtained using the standard PinPoint mode, while (b) and (e) were acquired using the Fast PinPoint mode under the same conditions. (c) presents the multi-line profile of Z height corresponding to (a) and (b); the green and blue lines represent the topographical data obtained by the standard and Fast PinPoint mode, respectively. (f) shows the multi-line profile of Young’s modulus extracted from (d) and (e). The green line corresponds to the modulus values measured by the standard PinPoint mode, whereas the blue line represents those obtained using the Fast PinPoint mode.
PS/LDPE is a sample blended with two different polymers, PS and LDPE. Typical modulus values of PS and LDPE are ~2.0 GPa and ~0.2 GPa, respectively. [2] As shown in Fig. 4, when the same region of a sample was measured using both the PinPoint mode and the Fast PinPoint mode, the obtained mechanical property values were found to be nearly identical. In addition, the measurement time was significantly reduced with the Fast PinPoint mode, up to 7 times faster compared to the PinPoint mode.
This result demonstrates that the Fast PinPoint mode not only enables faster imaging than the PinPoint mode but also maintains the same level of measurement precision. By providing quantitative mechanical data with significantly higher throughput, Fast PinPoint effectively minimizes time inefficiency in experiments involving mechanical property mapping, thereby enhancing overall research productivity.
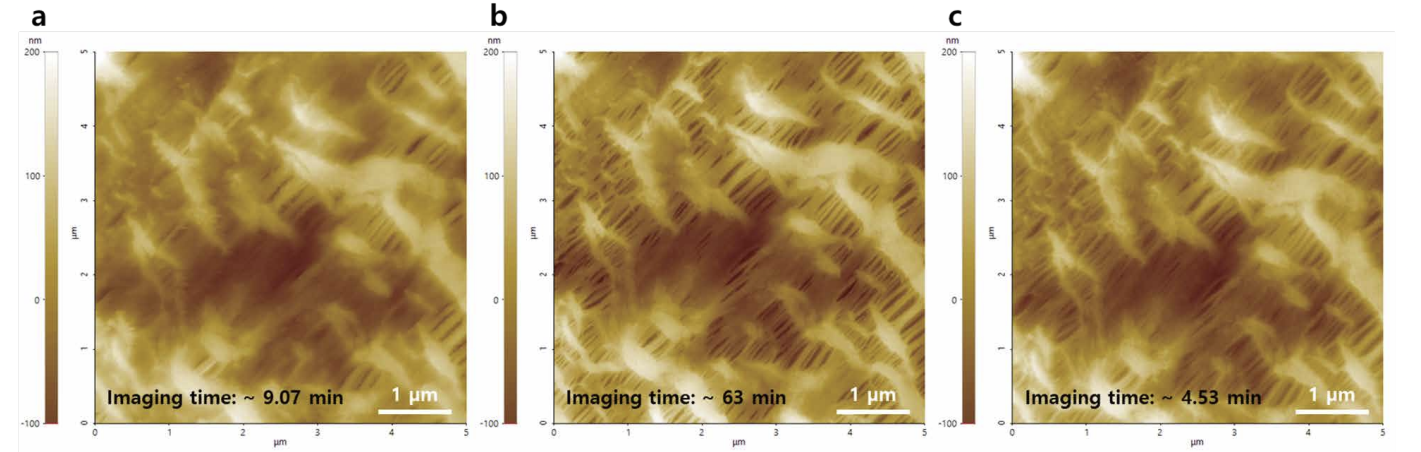
Figure 5. (a) Topographical image of the celgard (Microporous polypropylene separator widely used in lithium-ion batteries.) sample obtained by non-contact mode. (b) Topographical image obtained using standard PinPoint mode. (b) Topographical image acquired by the Fast PinPoint mode.
As shown in Fig. 5, standard PinPoint mode is often employed to characterize samples that are difficult to measure in contact mode, such as those that tend to drift or deform under the tip. The Fast PinPoint mode can also be applied to such samples, offering much faster data acquisition without sacrificing measurement stability.
In contrast to the tapping mode, which typically requires a stiff cantilever with a high resonance frequency due to its feedback mechanism, the Fast PinPoint mode allows the use of cantilevers with lower spring constant. This enables imaging with minimal sample damage, making it highly suitable for soft or delicate materials while maintaining reliable topography and mechanical property mapping.
Conclusions
These results clearly demonstrate that the Fast PinPoint mode effectively overcomes the major and long-standing limitation of the standard PinPoint mode – its long measurement time – while still providing quantitative and reliable mechanical property data.
By resolving this issue, the Fast PinPoint mode enables researchers working with polymer, organic, and biological samples to acquire a larger amount of high-quality data within the same instrument running time, without compromising accuracy. As such, it can serve as a key operating mode for users who require both speed and precision in nanomechanical characterization.


